Textual Logging
This topic describes the textual logging mechanisms available to help debugging the Communication-related components.
Most Comms components can output debugging information. These components must be configured to output information, with the configuration procedure dependent on the logging mechanism used by the component. The following mechanisms are used to log the information:
Flogger - This logging mechanism is a file logger. It used to be the standard mechanism for Comms logging, but it is being replaced by CDU (below).
Comms Debug Utility (CDU) - This logging mechanism is currently used for the majority of Comms logging. It is the successor to Flogger and adds a two-phase logging system to give flexibility in debugging problems which are difficult to reproduce in debug binary files. It unifies Comms logging into one text file and allows the output to be redirected to RDebug for easier on-target debugging, or on emulator to the fast Windows Debug port. For more information see Post-processing CDU log files, Default CDU and Interpreting the log files.
Note: The CDU API is not published and so its APIs cannot be used for adding new logging.
Unified Trace/UTrace/ULogger - This logging mechanism is currently used for a small amount of Comms logging. For more information see How to Use ULogger with Comms
Proprietary - This logging mechanism belongs to the component itself. A few components still use their own logging mechanisms, but these usually behave similarly to Flogger in that to obtain the logs the appropriate folder needs to exist while the component is running.
Note: When you enable logging for a component, the component may run significantly slower as it performs the logging. This could make reproducing a problem more difficult if the reduced component execution performance changes the sequence of events leading to the problem.
Post-processing CDU log files
The CDU log file format is designed to be viewed unprocessed. However, in some cases post-processing is required. Two post-processing tools are available:
Splitlog - is supplied in
epoc32\toolsand splits the singlelog.txtfile into multiple files by each unique tag combination. This tool is used to extract embedded binary logging such as that for PPP described below in Component-Specific Debugging Help.Networking Message Sequence Display Tool - processes a standard
log.txtfile to extract the Comms Framework messages and generates HTML/SVG output files for display on a suitable SVG-enabled browser.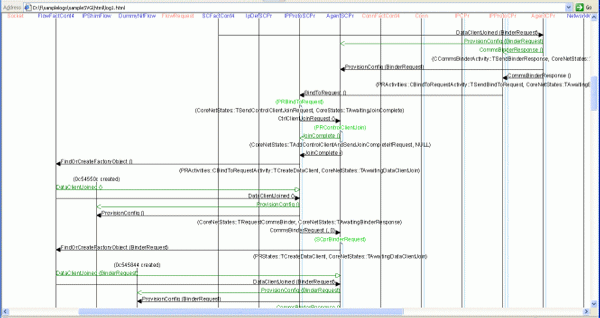
Figure: Figure 1 - Example SVG output from the Message Sequence Display Tool
Default CDU
CDU provides a default configuration file which lists all the known components which use it, and also provides a reference listing of iby files and their respective component source code and log tags. Figure 2 provides a snapshot of the configuration file:

Figure: Figure 2 - The default commsdbg.ini file
The default CDU file is located at ..\comms-infras\commsdebugutility\group\commsdbgdefault.ini and is available for the emulator in epoc32\<data|release\winscw\<udeb|urel>>\z\resource\commsdbg.ini.
Interpreting the log files
Comms components have specific log file schemes with some similarities. The following are guidelines for interpreting the files:
Errors are logged - when a panic or other serious error condition is encountered. Often the last few log lines includes where the critical condition was reached, since usually the panic code or error code alone is not enough. If not, then often searching for "warning" or "error" in the earlier logging will identify where the problem began.
Multi-threaded module output prefixes thread number - ESock and the C32 Serial Server prefix the log lines with the thread number within the specific thread numbering scheme. For example:
esock   esock   a 2e W0: CWorkerThread::ConstructL Init RS ChannelHandler
esock   esock   a    32    W4: SocketServer::InitL() Done!
esock   Booting a 32 W4: CWorkerThread::ConstructL Init ProtocolManager
The log lines indicate that ESock's Worker zero - the main thread - has initiated construction of its Rootserver (RS) communications channel, while Worker four has started constructing the Protocol Manager.
Note: The "2e" and "32" numbers are the kernel's own numbers for these threads.